


Key Driver Analysis Tool
Ever surveyed your clients to find out what is important to them, then focused on those aspects only to find it didn’t move the needle?
Applying Key Driver analysis methods can yield more accurate insights into what really drives client satisfaction and the easiest and cheapest way to apply them is using JumpData’s Key Driver Analysis tool.
*JumpData’s Key Driver Analysis tool offers 2 weeks of free trial.
What is Key Driver Analysis?
Key Driver Analysis, or Relative Importance Analysis, is the generic name for a number of regression / correlation-based techniques that aim to discover which of a set of independent variables (known as the drivers) has the greatest impact in determining the value of a specific dependent (or outcome) variable. These techniques essentially assign a weight to each driver that represents its importance in predicting an outcome variable relative to the others.
For example, suppose you’ve conducted a market research survey measuring respondents’ satisfaction with a set of attributes: delivery time, efficiency, value for money, customer service etc., plus their overall level of satisfaction. An important research question would be then: which of these attributes truly influence the overall satisfaction? Which have little effect at all? This is where Key Driver Analysis comes in. And, if applied correctly, it can show you which attributes you, or your client, need to focus on to have the greatest impact on your performance.
There are two simple, yet naive, approaches to conducting Key Driver Analysis:
- you could calculate the correlation coefficient between each driver and the independent variable (and perhaps square it) and use these as the importance weights;
- alternatively, you could conduct a multiple linear regression analysis and use the (standardised) regression coefficients.
However, with many types of data where Key Driver Analysis is required – in particular survey satisfaction data – the independent variables are strongly related to each other – a phenomenon known as multicollinearity. This can result in importance values that are derived from such naive analyses being wholly inaccurate and potentially highly misleading (see https://en.wikipedia.org/wiki/Multicollinearity). It is the view of most statisticians that neither of these naive approaches are to be recommended.
Ever wished to run advanced Key Driver Analysis but didn’t have either the statistical tools or expertise to conduct it effectively?
JumpData’s online Key Driver Analysis Tool is your answer.
It requires no statistical knowledge from the user or third-party software. You simply upload your data to the tool with results returned in graphical and tabular format – typically in a few seconds.
It is perfect for researchers, and marketeers who need to interpret Key Driver results in the knowledge that the analysis has been conducted for them in the most rigorous manner. Our tool will enable all researchers to conduct Key Driver Analysis with a minimum of fuss.
The JumpData online Key Driver Analysis Tool produces easily interpretable Key Driver Analysis results in a very short space of time.
For a more detailed explanation of the product, please either watch the video of the tool in action, or read the document Key Driver Techniques.
See a video of the tool in action:
Key Driver Techniques:

Details about KD tool
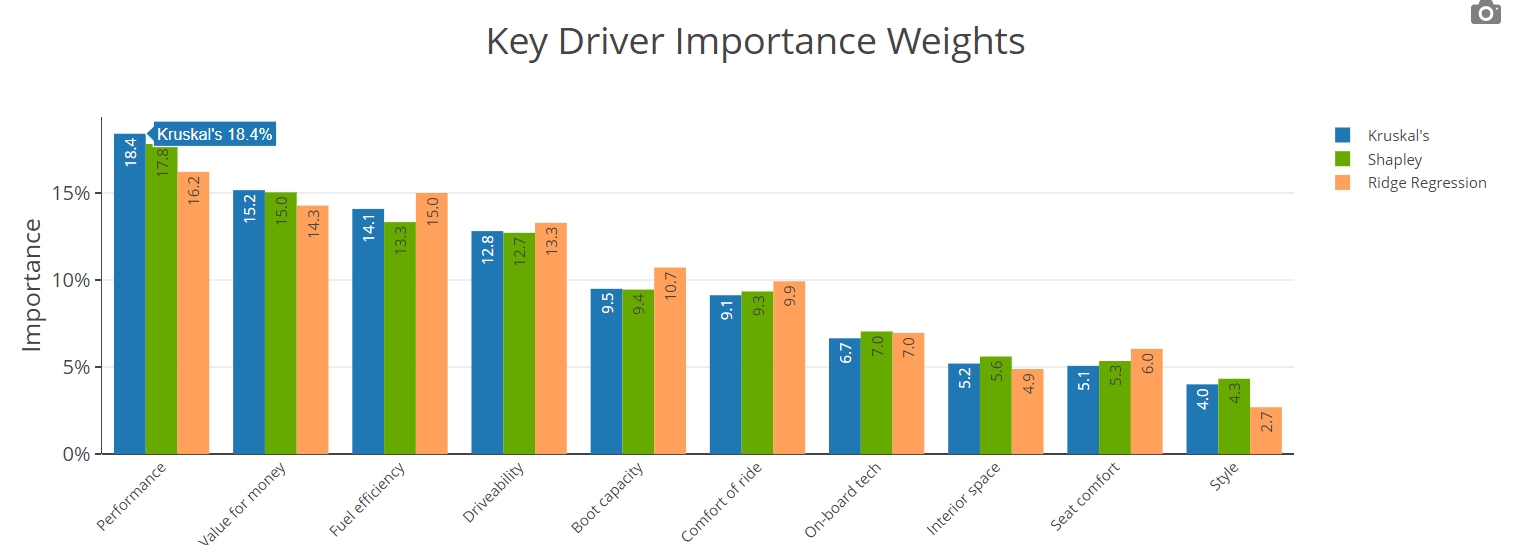
Three Key Driver Analyses at once
The tool simultaneously conducts three of the most well-respected statistical techniques used to overcome multicollinearity in regression analysis.
Easy to use
The tool can be operated from any web browser, so no additional software is needed.
Simple Data Upload
Reads either csv or excel files with no restriction on the number of cases.
Various User-friendly Outputs
Produces both graphical and tabular results for all three techniques.
Downloadable Outputs
Allows all results to be exported into csv file, with downloadable graphs.
other features
The tool additionally returns the following outputs.
Multiple Linear Regression
Simple Regression output to allow for assessment of “fit” of model.
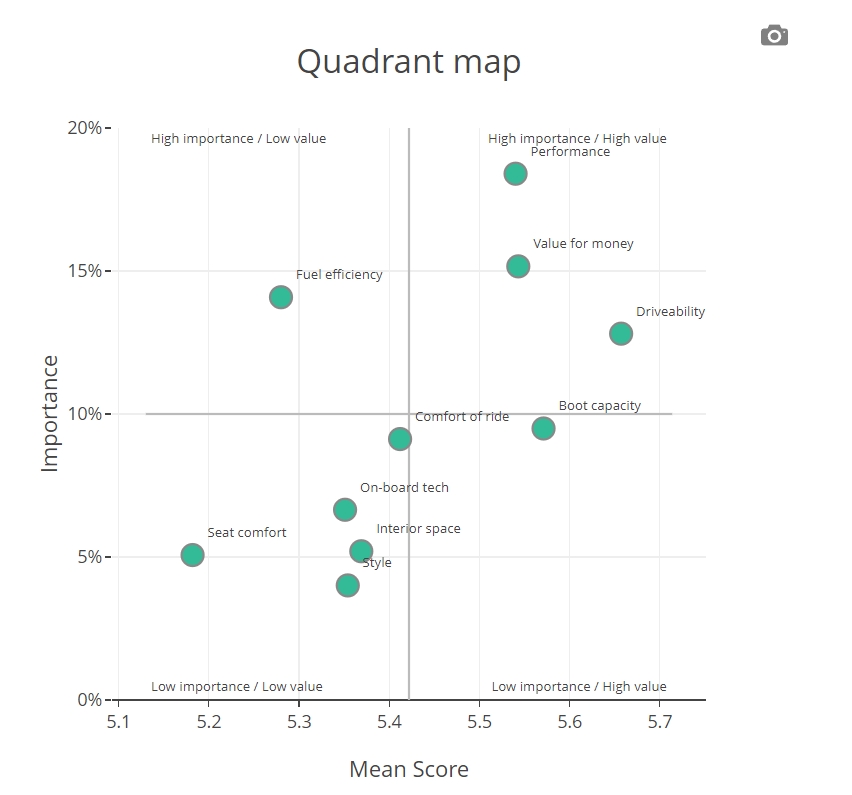
Quadrant Maps
A scatter plot of mean scores against Kruskal’s weights of the drivers.
Custom Reports
This feature will be available in the future
Standard Key Driver Tool Outputs
Click on an image to see details
our Pricing Plans
All prices exclude VAT.
Quadrant Maps
The results of your key driver analysis can also be visualised on a quadrant map. The x-axis is the importance weight of the driver and the y-axis its mean, top box or other measure of value. In all cases, we split the scatterplot into the four regions below for ease of interpretation:
- High importance / Low value (Key weaknesses)
- High importance / High value (Key strengthes)
- Low importance / High value
- Low importance / Low value
Drivers that fall in the two top two quadrants (Q1 and Q2) are those that are most important in determining the value of the dependent. In the case of satisfaction surveys, this is often interpreated as the key weaknesses of the organisation (Q1), or its key strengthes (Q2). Clearly, those in Q1 are the areas where the organisation should be focusing their investment to improve satisfaction, whilst those in Q2 are areas where they need to continue to perform well, to maintain their current satisfaction level.
The bottom two quadrants contain drivers that are less important. Nonetheless, it is still a good idea to be able to visualise strengthes and weakenesses – even for less important drivers.
The tool automatically produces a quadrant map plotting mean scores against Kruskal’s weights of the drivers. The data can be downloaded to change the quadrant map as suits the analysis. Often it is more appropriate to use top box as the means are clustered together. These can be easily calculated from the original data set.
How the KD tool deals with multicollinearity?
The JumpData Key Driver Analysis Tool uses the following three techniques to counter the effect of multicollinearity.
- Shapley Value Analysis (see for example, Ulrike Grömping, The American Statistician 2007);
- Kruskal’s Relative Importance Analysis (William Kruskal, American Statistician 1987);
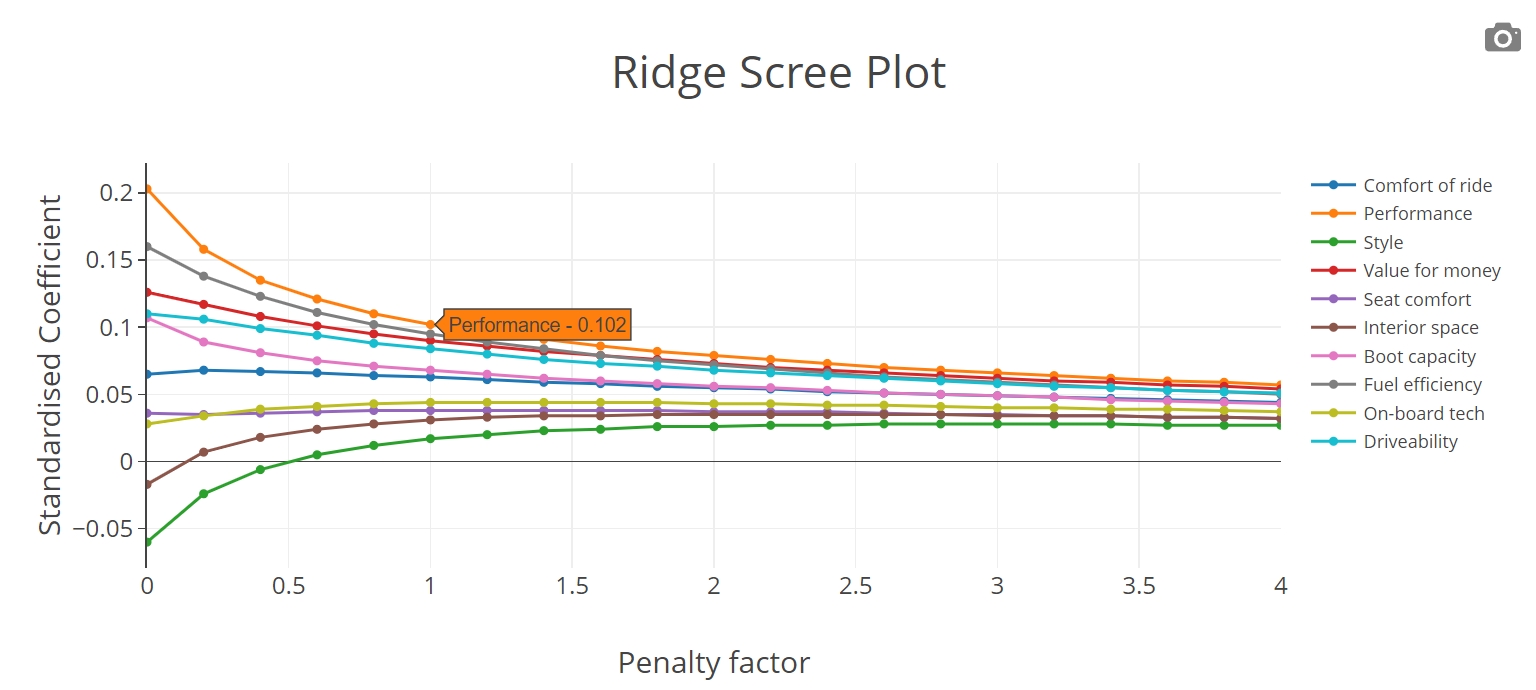
- Ridge Regression (also known as Tikhonov regularization; see for example https://en.wikipedia.org/wiki/Tikhonov_regularization).
For a more detailed explanation of the difference between these techniques, and how we suggest you use the tool / interpret the results, read the following blog post, or download the document Key Driver Techniques linked to this page.
Frequently Asked Questions
What is Key Driver Analysis Tool?
We, at JumpData have developed an easy to use, web-based tool that simultaneously conducts three of the most well-respected statistical techniques used to overcome multicollinearity in regression analysis. Our tool will enable all researchers to conduct Key Driver Analysis with a minimum of fuss.
How much does it cost?
The tool is available to use FREE for a two-week trial period. Afterwards the tool costs £50 for a 4-week project, £40 a month for 2 or more months subscription, or £400 for a yearly subscription (exc. VAT).