Data-Driven Applications And Services
Organisations often have the need for data-driven applications and services. We are highly skilled in most relevant computer languages, e.g., Python, SQL, R, JavaScript, VBA and have extensive database and spreadsheet knowledge. Thus we can build, and maintain when required, on and off-line dashboards, databases with appropriate interfaces, and other ad-hoc statistical applications. More importantly, we always construct the most efficient data pipelines.
data-driven applications
We build a wide range of data-driven applications from complicated forecasting tools or simulators (often spreadsheet based), to secure databases with either web-based or off-line interfaces, to stand-alone unique statistical applications, such as bespoke sampling or advanced statistical analysis tools.
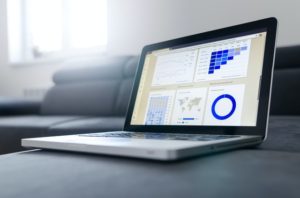
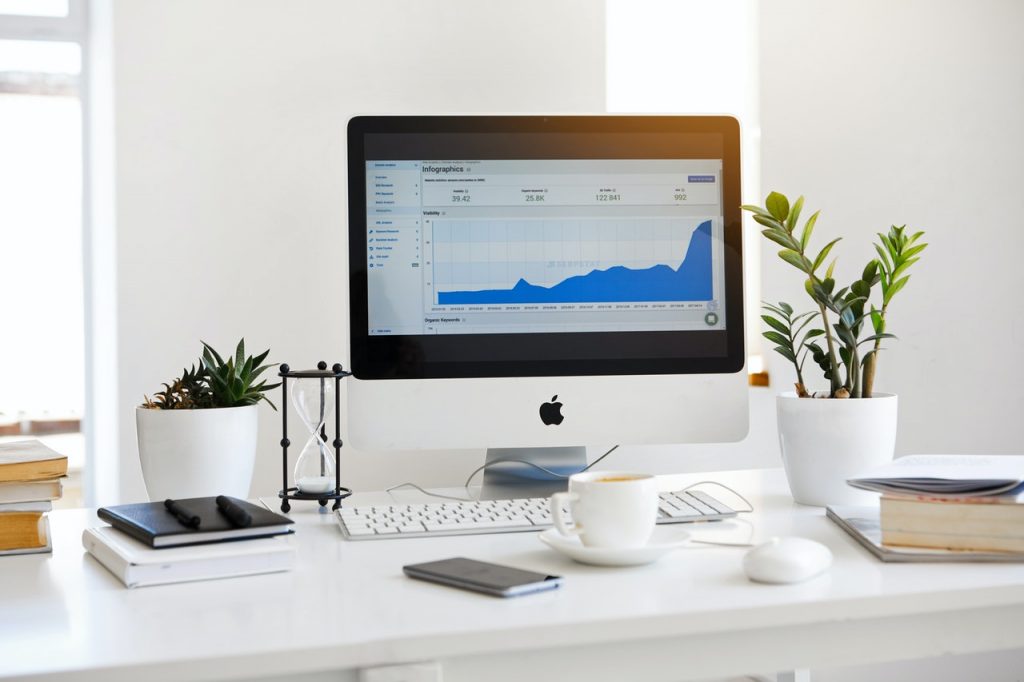
Data dashboards and similar tools are now an integral component of organisations’ data reporting and there are many pieces of inexpensive dashboarding software on the market to assist in their construction. However, what many organisations struggle with is the construction of the simple data-pipelines to convert the various datasets from source into the final output (the ETL part).
We are specialists in this area and have vast experience transforming existing (often manual) production of dashboards and other reports into one smoothly running procedure.
We have built such pipelines using APIs from Google, YouTube, Facebook and Twitter Analytics, and various Point of Sale and online booking systems. In each case we will assist in the protected hosting of the final transformed data, whether internally or to a secure cloud server.
From Our Work
From the blog
Dashboard design
We are proficient in the use of most commercial dashboarding software such as Google Data Studio and Tableau, so can construct dashboards as required.
Our commercial experience allows us to offer advice in the choice and construction of the most relevant KPIs. Also our collaborative approach and manner ensure that the client has ownership of what data is displayed and to whom.
To add to that – our skill set also includes the construction of dashboards using non-commercial software such as Python Dash and Bokeh, and R Shiny. So, if you require custom-built dashboards outside of the norm, we can provide that service as well.
For a small interactive example of a dashboard in Dash we have built, see:
